Age- and sex-specific human molecular signatures
As age and sex have been historically understudied factors in biomedical studies, there are now massive gaps in our understanding of genes and molecular mechanisms that underlie sex- and age-associated differences in physiology and in the incidence and presentation of many complex traits and diseases.
To begin addressing this gap broadly, we developed a machine learning (ML)-based approach to analyze tens of thousands of publicly-available human transcriptomes to infer numerous genome-wide molecular signatures specific to sex and age groups (citation below).
Using this web-app, users can query, visualize, and download:
- The normalized expression of one or more genes in samples across sex and age-groups.
- The age- and sex-associated gene scores of one or more genes.
- The age- and sex-associated enrichment of genesets annotated to hundreds of known pathways, cell types, phenotypes, traits, and diseases.
Find out more about the data and approach in the section below.
Cite
Leveraging public transcriptomes to delineate sex- and age-associated gene signatures and pan-body processes
Johnson KA, Krishnan A
bioRxiv (2023) DOI:10.1101/2023.01.12.523796.
Contact
Kayla Johnson (kayla.johnson@cuanschutz.edu)
Arjun Krishnan (arjun.krishnan@cuanschutz.edu)
Data and approach — an overview
Publicly-available gene expression data present an incredible opportunity to investigate the sex- and age-associated roles of human genes. These data come in the form of hundreds of thousands of expression profiles generated by hundreds of labs across the world over the past 25 years and stored in databases such as NCBI GEO and EBI ArrayExpress. These transcriptomes span multiple tissues, diverse experimental, biomedical, and environmental conditions, and numerous diseases.
However, leveraging these data to study sex and age is challenging because metadata about age and sex is often missing, inconsistent, or disorganized. Especially because age and sex have been historically understudied, the vast majority of these samples are not associated with any age and sex information. Sample descriptions that do contain this information often have it buried in free text and many are annotated with vague labels that are minimally informative and imprecisely defined as, for e.g., ‘old’, ‘adult’, or ‘infant’ (i.e., without the associated age ranges), making it difficult for researchers wishing to reanalyze these datasets.
Sex- and age-annotated public transcriptomes
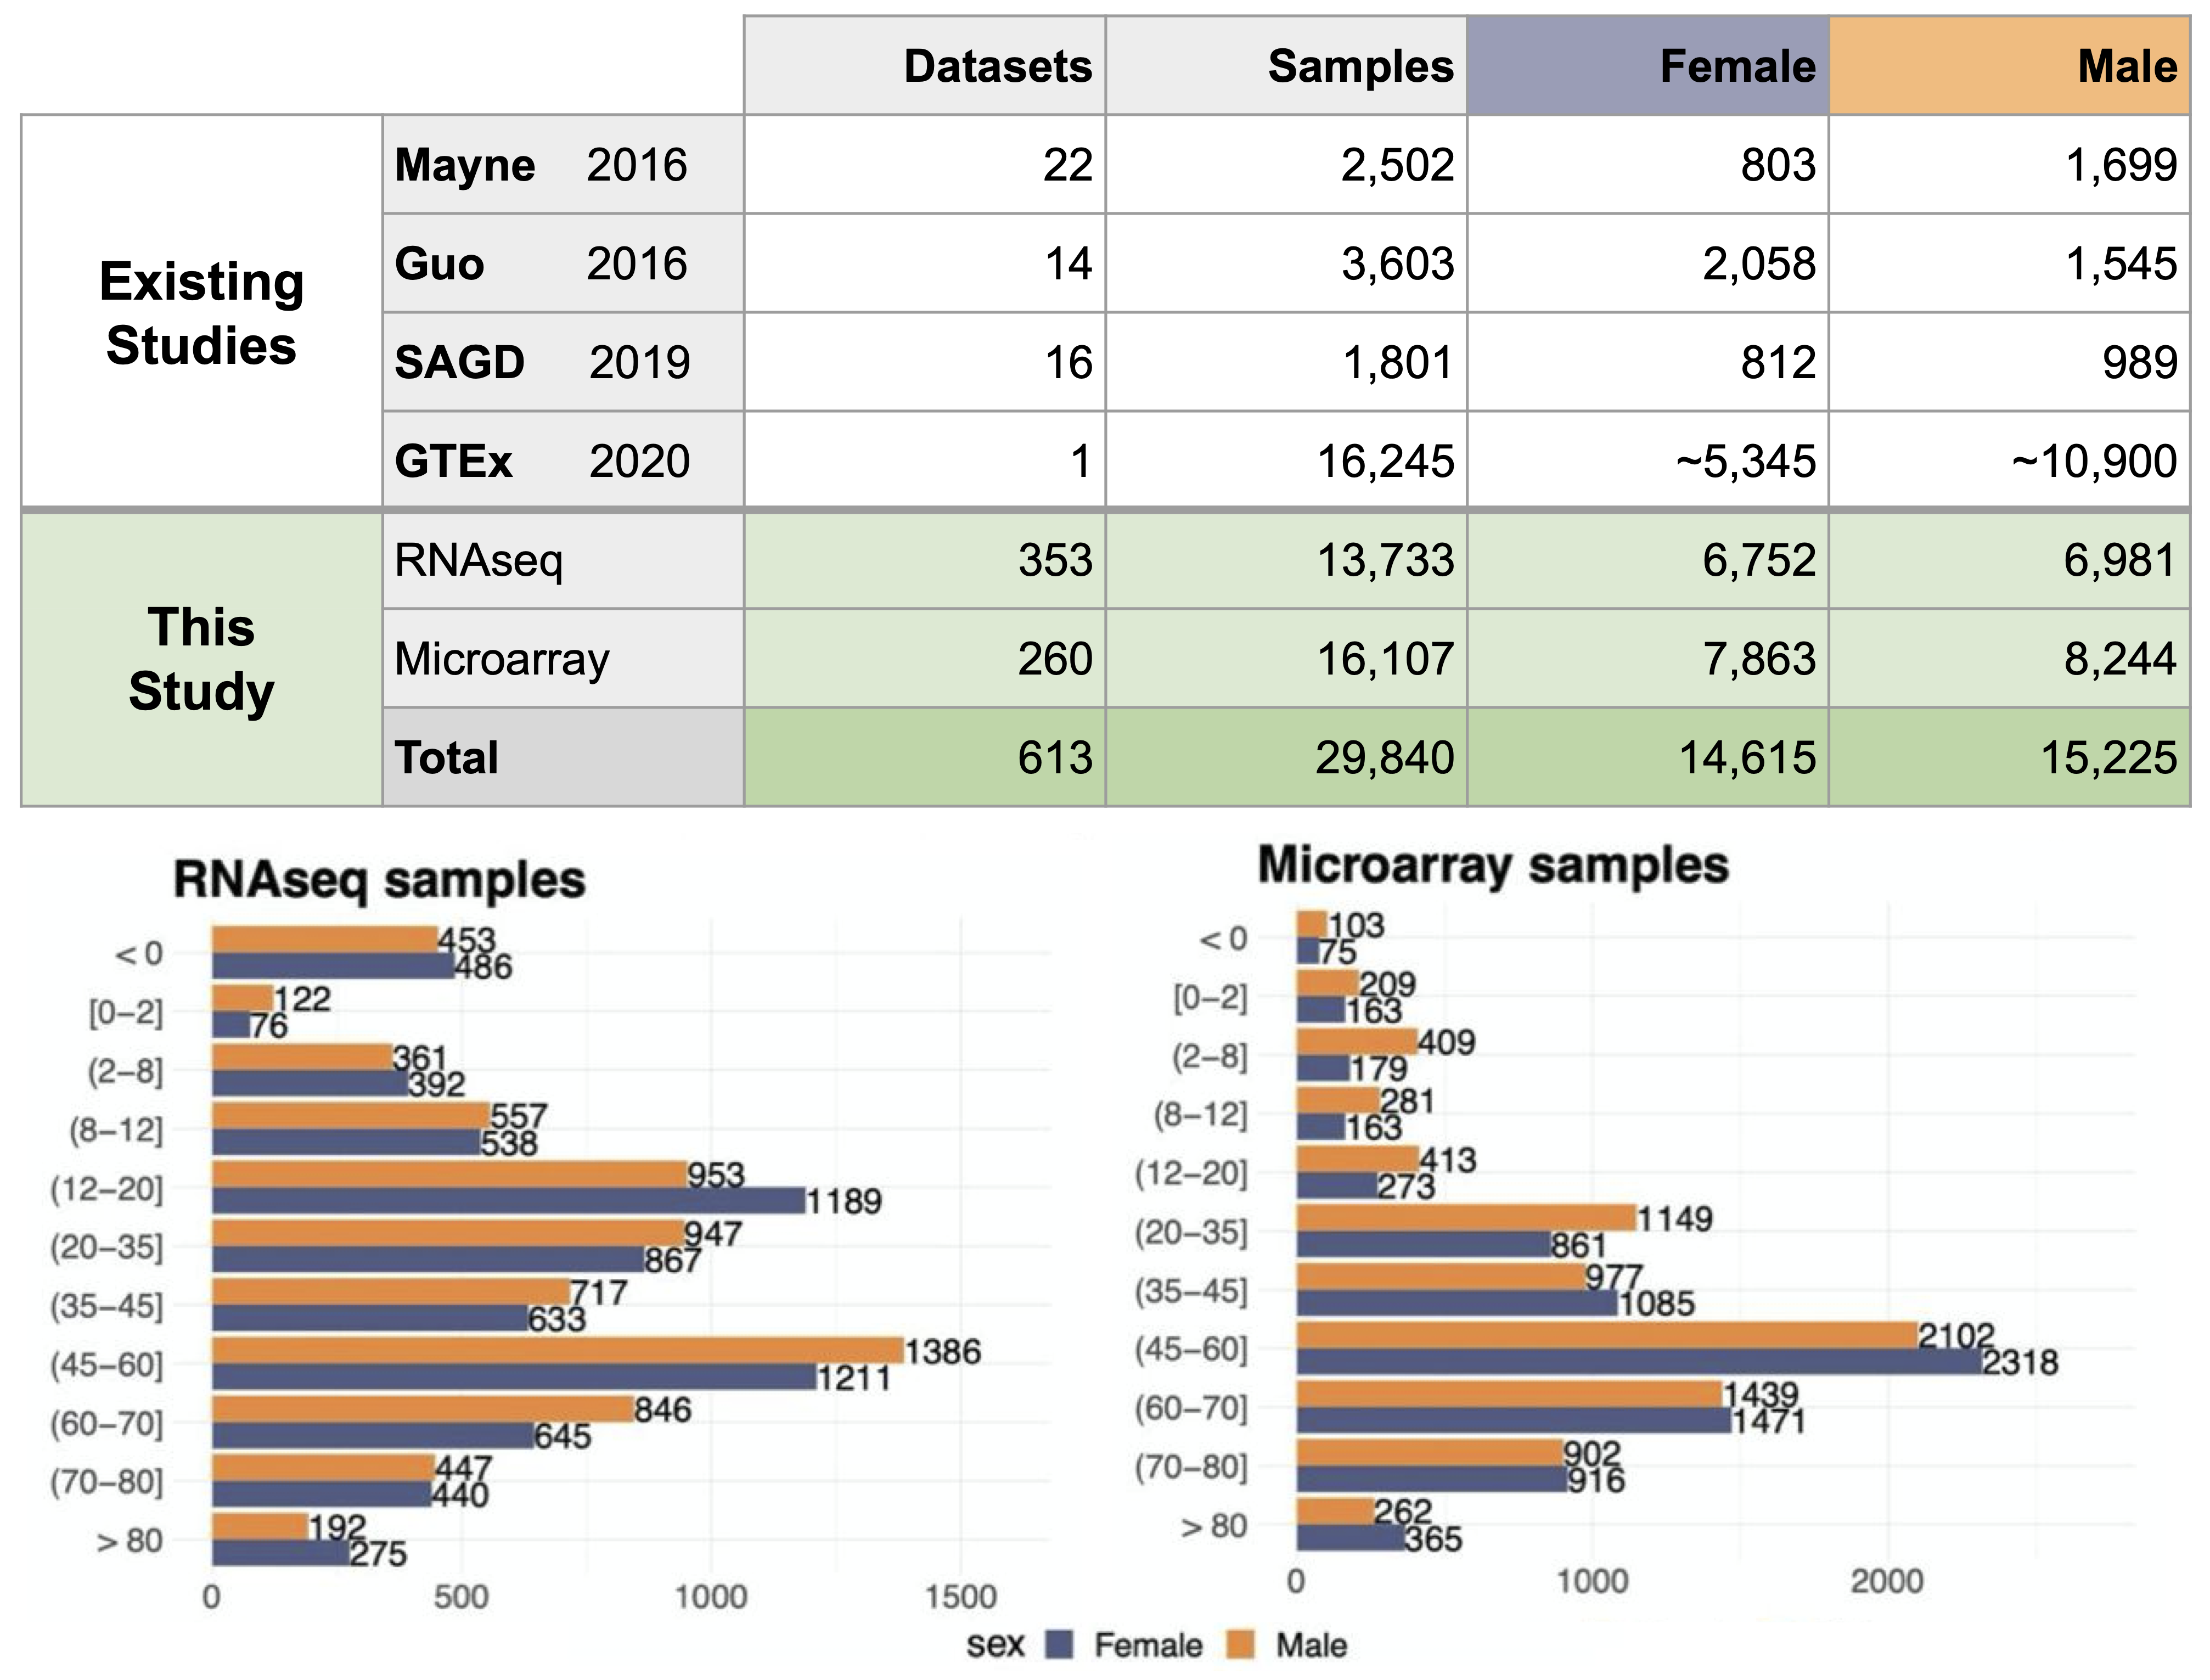
To address this challenge, we manually curated the largest sex- and age-annotated public bulk transcriptome dataset containing 29,840 samples from human microarray (13,733 samples) and RNA-seq (16,107 samples) technologies. These samples come from individuals from 11 age groups that span the entire human lifespan, with nearly equal representation from females and males. These are primary human samples, i.e., no single cell or single nuclei data, xenografts, microbiome samples, pooled samples, and cell lines.

ML approach to infer molecular signatures
Next, we used this curated transcriptome dataset to infer sex- and age-associated gene signatures.
Age-stratified sex-biased genes
Taking advantage of our age annotations, we analyzed samples within each of the 11 age groups, calculating a score for each gene that reflects the ability of separating female samples from male samples using that gene’s expression. This score represents that gene’s sex-bias in that age group.
Sex-stratified age-biased genes
Then, we trained logistic regression (LR) models (separately for samples in females and males) to predict each sample’s age group based on the genome-wide expression profile from that sample. The trained LR model automatically calculates a score for each gene that reflects that gene’s strength and direction of importance (positive or negative) in predicting a sample’s age group.

Age-stratified sex-biased signatures
Explore the age-stratified sex-biased enrichment of genesets annotated to hundreds of known pathways, cell types, phenotypes, traits, and diseases. The plots and tables show the sex-bias of these genesets in each of 11 age-groups across the human lifespan.
Sex-stratified age-biased signatures
Explore the sex-stratified age-biased enrichment of genesets annotated to hundreds of known pathways, cell types, phenotypes, traits, and diseases. The plots and tables show the age-bias of these genesets in females or males.
Signatures
Explore the expression signatures of multiple genes of interest across sex and age groups. Upon selecting age or sex bias, RNA-seq or microarray data, and entering your genes of interest, the heatmap below shows the age- or sex-biased score for each gene in each age group.